For my Instrumentation class, we were tasked with determining the position of a mass on a mechanical oscillator using a transducer. We chose the accelerometer, which is the most difficult transducer to use compared to the others because it has a 2nd order response. Thus, a lot of signal conditioning steps need to be applied to the output of the transducer to find the actual displacement.
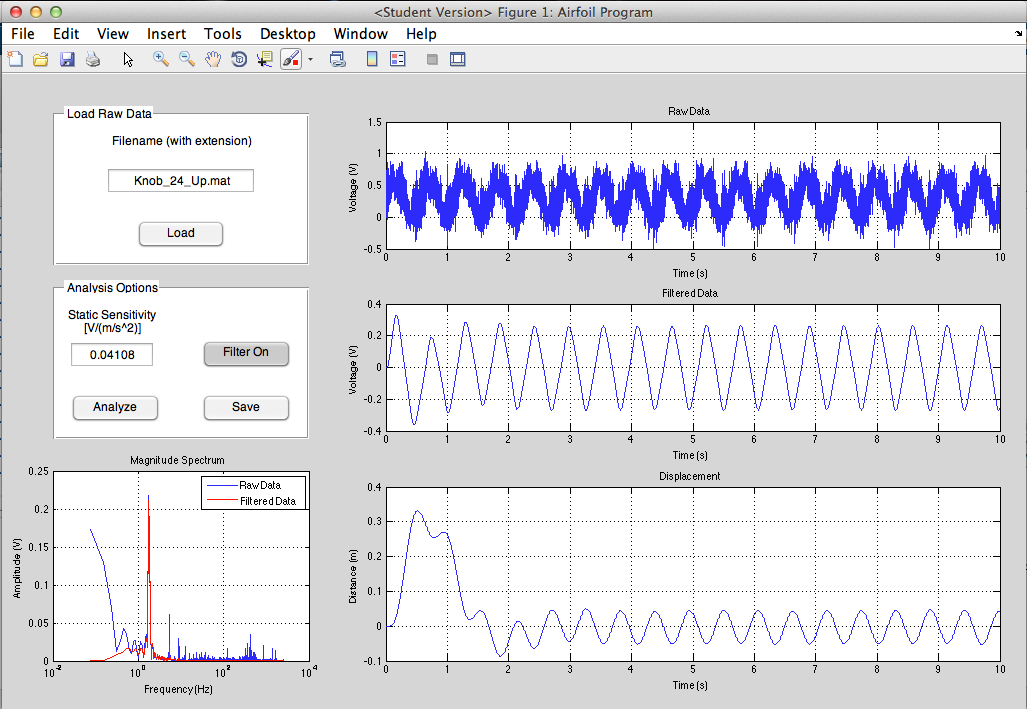
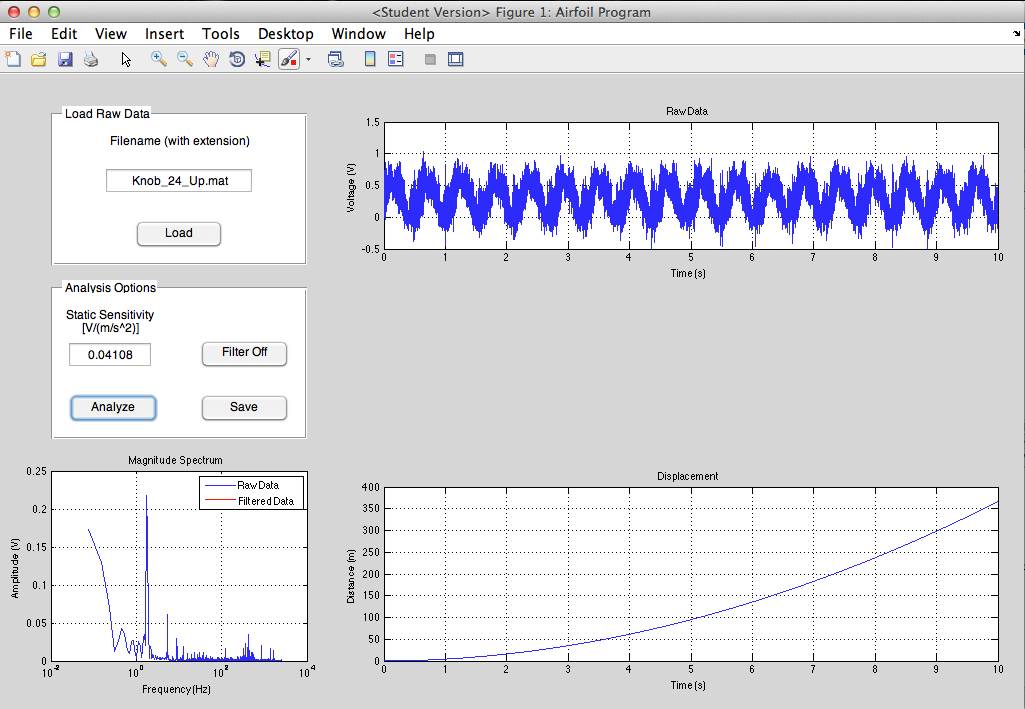
Originally, each signal conditioning step was its own MATLAB script. But because the scripts all had different authors, it was difficult for any one of us to go from start to finish with a set of raw data. My solution to this problem was to create a user interface that would allow us to quickly and easily analyze sets of data. The data acquisition would remain its own script and the raw data was saved as a MATLAB data file. The filename is then entered into the GUI and the data is loaded. The static sensitivity of the accelerometer (obtained via calibration) can be entered into the box, but the value from our calibration is already set as the default. The 'Analyze' button does several calculations and makes a few different plots.
The first plot made is just the raw data. The second plot is the magnitude spectrum of the data, so the frequency of our signal and of any noise can be identified. Then the data goes through a bandpass filter to remove the high frequency noise and the DC offset. This filtered voltage as well as its FFT are then plotted. Finally, the signal goes through a double numerical integration to convert the acceleration values into displacement. Because of the cumulative integration technique used, a high pass filter is needed in between integration steps to remove the offset.
Overall I'm quite pleased with how it turned out. I may add more functionality to achieve more of the project's deliverables, but for now this will do.
EDIT: Final Project Report